Dunkin’ Donuts NNN Properties For Sale
Access Quality Triple Net Lease Investments
Below are
Dunkin’ Donuts NNN Properties for Sale
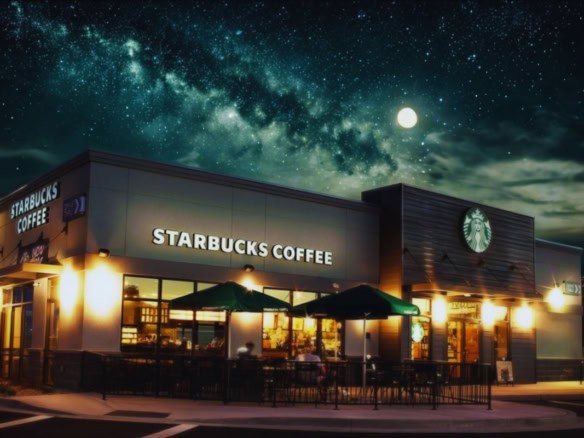
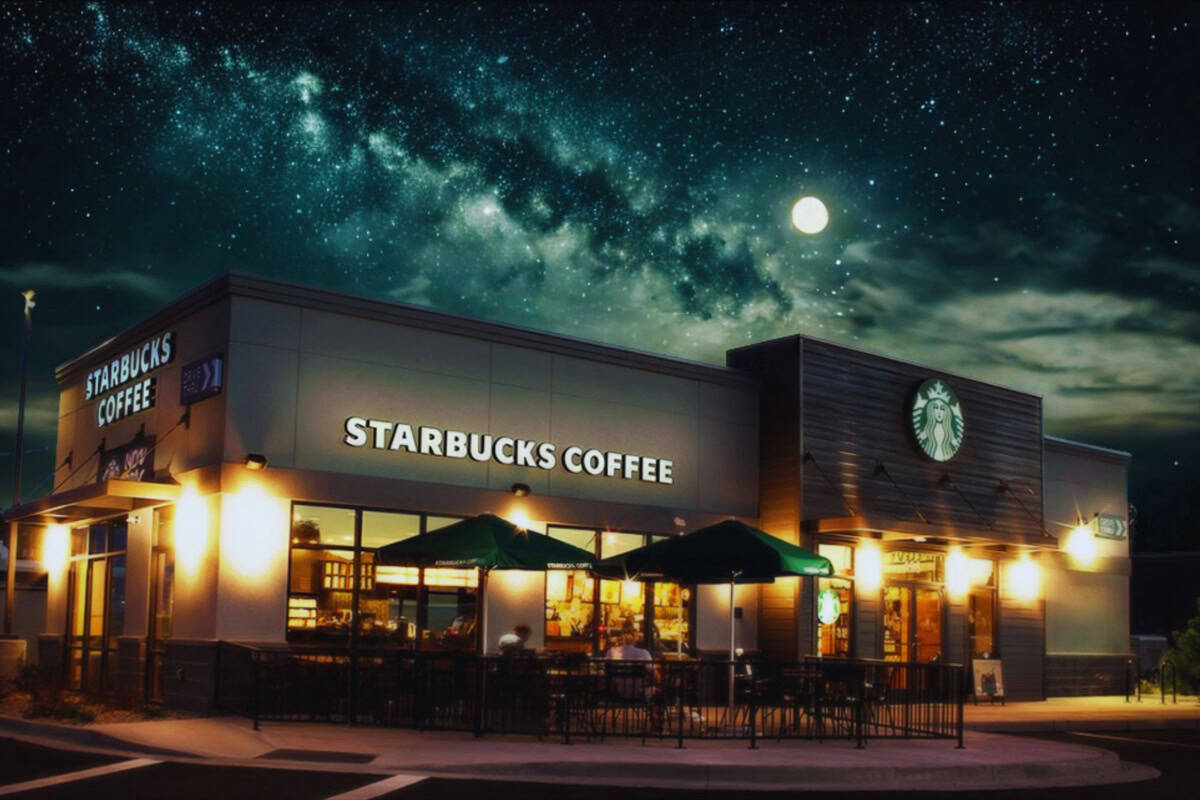
Starbucks
- $2,764,000
Starbucks NNN for Sale in Las Vegas, NV — $2.8M | 5.0% Cap
Las Vegas, Nevada
5.0%
$138,176
7.7 years left
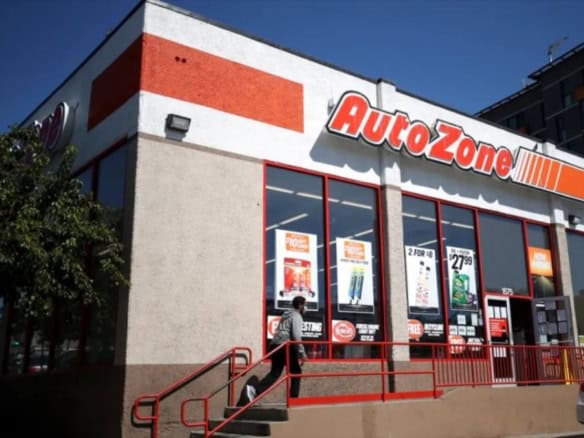
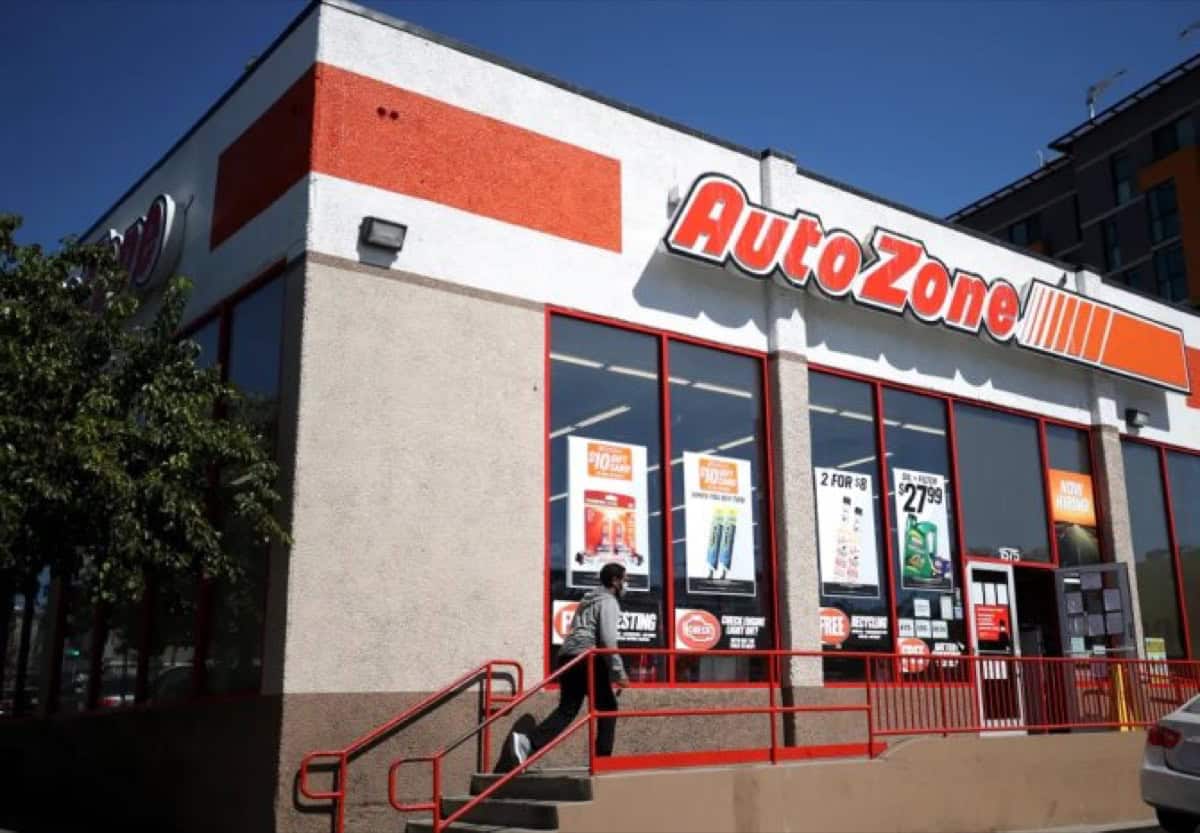
AutoZone
- $2,005,000
AutoZone NNN for Sale in Homestead, FL — $2.0M | 4.5% Cap
Homestead, Florida
4.5%
$90,200
8.1 years left
Family Dollar
- $914,664
Family Dollar NNN for Sale in Natchez, MS — $915K | 9.5% Cap
Natchez, Mississippi
9.5%
$86,893
5.4 years left
Advance Auto Parts
- $993,243
Advance Auto NNN for Sale in Kalkaska, MI — $993K | 7.4% Cap
Kalkaska, Michigan
7.4%
$73,500
10.8 years left
Dollar General
- $1,699,970
Dollar General NNN for Sale in Brodhead, KY — $1.7M | 7.0% Cap
Brodhead, Kentucky
7.0%
$118,998
12.8 years left
Chick-fil-A
- $5,422,000
Chick-fil-A NNN for Sale in Acworth, GA — $5.4M | 4.15% Cap
Acworth, Georgia
4.15%
$225,000
15.1 years left
Dollar General
- $2,045,095
Dollar General NNN for Sale in Cygnet, OH — $2.0M | 6.85% Cap
Cygnet, Ohio
6.85%
$140,089
14.1 years left
Dollar General
- $2,001,000
Dollar General NNN for Sale in Cullman, AL — $2.0M | 6.8% Cap
Cullman, Alabama
6.8%
$136,068
15.2 years left
McDonald's
- $2,667,000
McDonald NNN for Sale in San Antonio, TX — $2.7M | 3.75% Cap
San Antonio, Texas
3.75%
$100,000
19.4 years left
Starbucks
- $3,600,000
Starbucks NNN for Sale in Sacramento, CA — $3.6M | 5.0% Cap
Sacramento, California
5.0%
$180,000
15.1 years left
Family Dollar
- $799,945
Family Dollar NNN for Sale in Clay City, KY — $800K | 9.0% Cap
Clay City, Kentucky
9.0%
$71,994
1.4 years left
Dollar General
- $1,570,000
Dollar General NNN for Sale in Dallas, TX — $1.6M | 6.0% Cap
Dallas, Texas
6.0%
$94,199
8.2 years left
Starbucks
- $2,764,000
Starbucks NNN for Sale in Las Vegas, NV — $2.8M | 5.0% Cap
Las Vegas, Nevada
5.0%
$138,176
7.7 years left
AutoZone
- $2,005,000
AutoZone NNN for Sale in Homestead, FL — $2.0M | 4.5% Cap
Homestead, Florida
4.5%
$90,200
8.1 years left
Family Dollar
- $914,664
Family Dollar NNN for Sale in Natchez, MS — $915K | 9.5% Cap
Natchez, Mississippi
9.5%
$86,893
5.4 years left
Advance Auto Parts
- $993,243
Advance Auto NNN for Sale in Kalkaska, MI — $993K | 7.4% Cap
Kalkaska, Michigan
7.4%
$73,500
10.8 years left
Dollar General
- $1,699,970
Dollar General NNN for Sale in Brodhead, KY — $1.7M | 7.0% Cap
Brodhead, Kentucky
7.0%
$118,998
12.8 years left
Chick-fil-A
- $5,422,000
Chick-fil-A NNN for Sale in Acworth, GA — $5.4M | 4.15% Cap
Acworth, Georgia
4.15%
$225,000
15.1 years left
Dollar General
- $2,045,095
Dollar General NNN for Sale in Cygnet, OH — $2.0M | 6.85% Cap
Cygnet, Ohio
6.85%
$140,089
14.1 years left
Dollar General
- $2,001,000
Dollar General NNN for Sale in Cullman, AL — $2.0M | 6.8% Cap
Cullman, Alabama
6.8%
$136,068
15.2 years left
McDonald's
- $2,667,000
McDonald NNN for Sale in San Antonio, TX — $2.7M | 3.75% Cap
San Antonio, Texas
3.75%
$100,000
19.4 years left
Starbucks
- $3,600,000
Starbucks NNN for Sale in Sacramento, CA — $3.6M | 5.0% Cap
Sacramento, California
5.0%
$180,000
15.1 years left
Family Dollar
- $799,945
Family Dollar NNN for Sale in Clay City, KY — $800K | 9.0% Cap
Clay City, Kentucky
9.0%
$71,994
1.4 years left
Dollar General
- $1,570,000
Dollar General NNN for Sale in Dallas, TX — $1.6M | 6.0% Cap
Dallas, Texas
6.0%
$94,199
8.2 years left
Dunkin’ Donuts NNN Properties for Sale — Morning Daypart Dominance Coffee + Breakfast Investment Leader
Dunkin’ Donuts NNN properties offer investors access to America’s morning daypart leader with 9,000+ US locations (largest coffee + breakfast chain by footprint, 3x Starbucks 3,000 company-owned domestic stores, coast-to-coast penetration vs regional competitors),

$1.1M average unit volume (franchisee profitability $150K-250K EBITDA per store, moderate economics support 6.0-7.0% rent coverage healthy), drive-thru critical format (70%+ sales off-premise, pandemic-proof operational model, pickup + mobile ordering dominance eliminates dine-in dependency), value positioning vs Starbucks ($3-5 coffee/breakfast sandwich vs Starbucks $5-8 premium, working-class demographic, recession-resilient affordable luxury),
multi-unit franchisee strength (99% franchised model, 10-30+ store operators typical, scale economies, experienced management, avoid single-unit mom-and-pop risk), Northeast stronghold legacy (Boston heritage 1950 founding, New England/Mid-Atlantic density unmatched, brand loyalty generational, 50%+ Northeast store concentration),
Inspire Brands corporate backing (private equity Roark Capital 2020 acquisition, portfolio includes Arby’s, Buffalo Wild Wings, Jimmy John’s, Sonic, institutional resources scale), 15-20 year absolute NNN leases (tenant pays all expenses, zero landlord responsibilities, rent escalations 10% every 5 years or 1.5-2% annually),
and 6.0-7.0% cap rates (franchisee-backed pricing reflects individual operator credit, 100-150 bps premium vs corporate-guaranteed Chipotle 5.0-5.5%, comparable Wendy’s franchisee 6.0-7.0%) creating stable passive income for 1031 exchange investors, family offices, and experienced NNN portfolios seeking morning daypart diversification complementing QSR lunch/dinner holdings.
American Net Lease specializes in sourcing Dunkin’ NNN properties emphasizing drive-thru locations (70%+ sales critical format), multi-unit franchisee operators (10+ stores experience preferred, financial statement verification), and Northeast/East Coast corridors (strongest brand presence, generational loyalty, density advantages). Browse current listings or call 239.236.2626 to discuss Dunkin’ investment strategies.
Why Invest in Dunkin’ Donuts NNN Properties?
Dunkin’ Donuts dominates America’s morning daypart with unique strategic positioning differentiating from QSR lunch/dinner competitors and premium coffee alternatives:
(1) 9,000+ US store footprint (largest coffee + breakfast chain by location count, 3x Starbucks 3,000 company-owned domestic, coast-to-coast penetration every state, suburban saturation strategy fortressing markets creates local monopolies),
(2) Morning daypart monopoly (80%+ sales before 11am vs QSR lunch/dinner 11am-8pm peak, complementary revenue timing avoids direct McDonald’s/Wendy’s competition, breakfast + coffee non-discretionary daily habit recession-resilient),
(3) Value positioning vs Starbucks ($3-5 coffee/breakfast vs Starbucks $5-8 premium, working-class demographic targeting trades down from premium during economic stress, affordable luxury maintains frequency),
(4) Drive-thru operational dominance (70%+ sales off-premise, mobile ordering + pickup critical, pandemic-proof format COVID-19 resilience proven, reduced dine-in dependency eliminates seating real estate cost),
(5) Multi-unit franchisee scale (99% franchised model, 10-30+ store operators typical, economies scale purchasing/management, experienced operators vs single-unit mom-and-pop risk),
(6) Northeast stronghold legacy (Boston 1950 founding, New England/Mid-Atlantic 50%+ store concentration, generational brand loyalty “America runs on Dunkin’” cultural identity, density advantages delivery economics),
(7) Inspire Brands institutional backing (Roark Capital private equity $11.3B acquisition 2020, portfolio 32,000+ restaurants including Arby’s/BWW/Jimmy John’s/Sonic, institutional resources capital/technology/marketing scale),
(8) 6.0-7.0% cap rates (franchisee-backed pricing 100-150 bps premium vs corporate-guaranteed Chipotle 5.0-5.5%, yield advantage compensates individual operator credit risk, comparable Wendy’s franchisee-backed 6.0-7.0%) making Dunkin’ NNN properties morning daypart diversification adding coffee + breakfast complementing QSR lunch/dinner portfolios (McDonald’s/Wendy’s/Chipotle hold lunch 11am-2pm + dinner 5-8pm, Dunkin’ holds breakfast 6-11am = revenue timing diversification reduces single-daypart concentration risk).
1. Morning Daypart Monopoly — Coffee + Breakfast (80%+ Sales Before 11am)
Dunkin’ Donuts captures America’s morning daypart dominance differentiating from QSR lunch/dinner competitors creating revenue timing diversification:
(1) 80%+ sales before 11am (breakfast 6-9am peak, mid-morning coffee 9-11am, vs QSR lunch 11am-2pm + dinner 5-8pm peaks, complementary revenue timing avoids direct McDonald’s/Wendy’s competition),
(2) Coffee-first positioning (60%+ sales beverages, coffee drinks $3-5 vs food $4-7, higher-margin beverage category drives profitability, Dunkin’ dropped “Donuts” from name 2019 emphasizing coffee focus),
(3) Non-discretionary daily habit (morning coffee = routine necessity vs QSR lunch/dinner discretionary meal, recession-resilient behavior consumers prioritize coffee purchase even economic stress, vs cutting back restaurant dinners),
(4) Repeat frequency advantage (daily coffee customers 5-7x/week vs QSR lunch 2-3x/week, higher visit frequency generates consistent traffic, customer lifetime value superior repeat behavior),
(5) Speed-of-service critical (morning rush 7-9am customers demand <3 minute service, drive-thru + mobile ordering optimized speed, vs QSR lunch 5-8 minute acceptable, operational efficiency differentiated competency).
Morning daypart monopoly creates strategic advantages:
(1) Complementary QSR portfolio timing (Dunkin’ 6-11am + McDonald’s 11am-2pm + Wendy’s 5-8pm = full-day coverage, NNN portfolio diversification reduces single-daypart concentration risk),
(2) Weather-resilient traffic (morning coffee purchase less weather-sensitive vs lunch/dinner discretionary meals, winter/rain doesn’t reduce morning commute coffee stops),
(3) Work-from-home resilience (COVID-19 proved morning coffee habit persists even remote work, customers drive Dunkin’ before home office vs skipping lunch out, sticky behavior).
Morning daypart sales breakdown (Dunkin’ vs QSR competitors):
| Daypart | Dunkin’ % Sales | McDonald’s % Sales | Wendy’s % Sales | Strategic Implication |
|---|---|---|---|---|
| Breakfast (6-11am) | 80%+ (DOMINANT!) | 25-30% (growing) | 10-15% (weak) | Dunkin’ monopoly, complementary QSR |
| Lunch (11am-2pm) | 15% (minimal) | 35-40% (strong) | 40-45% (peak) | QSR dominance, Dunkin’ avoids competition |
| Dinner (5-8pm) | <5% (negligible) | 30-35% (strong) | 35-40% (peak) | QSR dominance, Dunkin’ exits |
Why morning daypart matters (investor perspective):
- Revenue timing diversification: Dunkin’ 6-11am + McDonald’s/Wendy’s 11am-8pm = full-day NNN portfolio coverage (reduces single-daypart concentration risk)
- Recession resilience: Morning coffee non-discretionary habit (consumers cut dinner out, maintain coffee purchase, affordable luxury $3-5 vs discretionary $10-15 QSR dinner)
- Daily frequency advantage: Coffee customers 5-7x/week vs QSR lunch 2-3x/week (higher repeat = consistent traffic, less vulnerable single-visit loss)
- Work-from-home resilient: COVID-19 proved morning coffee habit sticky (remote workers drive Dunkin’ before home office, vs skipping lunch restaurant)
Investment strategy: Buy Dunkin’ NNN as morning daypart complement to QSR lunch/dinner holdings (McDonald’s/Wendy’s/Chipotle = lunch/dinner, Dunkin’ = breakfast/coffee, portfolio diversification reduces daypart concentration risk, full-day revenue coverage).
2. Value Positioning vs Starbucks — Working-Class Hero ($3-5 vs $5-8 Premium)
Dunkin’ strategically positions as value alternative to Starbucks premium targeting working-class demographics creating recession-resilient affordable luxury:
(1) $3-5 coffee/breakfast vs Starbucks $5-8 (40-50% lower pricing, medium coffee Dunkin’ $2.50 vs Starbucks $4.00, breakfast sandwich Dunkin’ $4 vs Starbucks $6, value perception working-class accessible),
(2) Working-class demographic targeting (blue-collar workers, service industry, middle-income families, vs Starbucks white-collar professionals/tech workers upper-income, Dunkin’ “America runs on Dunkin’” cultural identity working-class pride),
(3) Recession-resilient trade-down (economic stress consumers trade down Starbucks → Dunkin’ maintaining coffee habit at lower price, vs eliminating Starbucks entirely, affordable luxury positioning protects frequency),
(4) Speed-of-service operational model (Dunkin’ optimized <3 minute drive-thru vs Starbucks 5-8 minute customization complexity, working-class customers prioritize speed over artisanal experience, efficient operations higher throughput),
(5) Suburban/small-town penetration (Dunkin’ 9,000 locations saturate suburbs/secondary markets vs Starbucks 3,000 urban/affluent focus, real estate accessibility working-class convenient locations near home/work).
Value positioning advantages:
(1) Economic downturn protection (2008 recession Dunkin’ traffic increased Starbucks trade-downs, COVID-19 Dunkin’ resilient working-class essential workers maintained habits, recession-resistant demographics),
(2) Market expansion runway (Dunkin’ underindexed South/West Coast vs Northeast saturation, Starbucks premium positioning limits small-town expansion, Dunkin’ value accessible secondary markets growth),
(3) Menu breadth revenue (Dunkin’ donuts + breakfast sandwiches + lunch wraps diversified vs Starbucks beverage-heavy 80%, food attach rate higher average check),
(4) Loyalty program scale (DD Perks 30M+ members, points-based rewards, vs Starbucks Rewards 31M, competitive loyalty frequency).
Dunkin’ vs Starbucks competitive positioning:
| Factor | Dunkin’ Donuts | Starbucks | Advantage |
|---|---|---|---|
| Pricing | $3-5 average | $5-8 average | Dunkin’ (40-50% cheaper, value) |
| Demographic | Working-class, middle-income | White-collar, upper-income | Dunkin’ (recession-resilient trade-down) |
| Store count US | 9,000 locations (largest footprint!) | 3,000 company-owned | Dunkin’ (accessibility, suburban saturation) |
| Speed-of-service | <3 min drive-thru (optimized) | 5-8 min (customization) | Dunkin’ (working-class priority speed) |
| Daypart focus | Breakfast/morning 80%+ sales | All-day (morning 40%, afternoon 60%) | Dunkin’ (morning monopoly, coffee-first) |
| Real estate | Suburban/small-town penetration | Urban/affluent corridors | Dunkin’ (market expansion runway South/West) |
| Menu breadth | Coffee + donuts + breakfast + lunch | Beverage-heavy 80%, food 20% | Dunkin’ (food attach rate, higher check) |
| Recession behavior | Trade-down destination (traffic ↑) | Trade-down source (traffic ↓) | Dunkin’ (affordable luxury maintains frequency) |
Why value positioning matters (investor perspective):
- Recession protection: Economic stress consumers trade down Starbucks → Dunkin’ (2008 recession Dunkin’ traffic +5-8%, Starbucks -10%, affordable luxury resilient)
- Working-class demographics: Essential workers, service industry maintained COVID-19 routines (vs white-collar work-from-home reduced Starbucks commute purchases)
- Market expansion: Dunkin’ underindexed South/West Coast (growth runway vs Northeast saturation, Starbucks premium limits small-town expansion)
- Frequency protection: $3 coffee daily sustainable working-class budgets (vs $5-8 Starbucks cutting frequency economic stress, Dunkin’ maintains 5-7x/week habits)
Risks to acknowledge:
- Premium competitors expanding: Starbucks 3,000 → 5,000 store goal (adds pressure, but Dunkin’ value moat protects working-class)
- Regional coffee chains: Tim Hortons Canada, Dutch Bros West Coast (local loyalty competition, but Dunkin’ scale advantages)
- McDonald’s breakfast competition: McCafé coffee $1-3 extreme value (undercuts Dunkin’ pricing, but quality perception inferior, Dunkin’ holds premium over McDonald’s)
Investment decision: Dunkin’ value positioning = recession-resilient working-class demographics (accept 6.0-7.0% caps franchisee-backed for trade-down protection, affordable luxury maintains frequency economic stress, vs Starbucks premium vulnerable discretionary cutbacks).
3. Drive-Thru Critical Operational Model — 70%+ Off-Premise Sales

Dunkin’ Donuts operates drive-thru dependent business model making format verification CRITICAL due diligence:
(1) 70%+ sales off-premise (drive-thru + mobile pickup dominates, dine-in <30% vs traditional QSR 50-60% dine-in dependency, pandemic-proof operational model COVID-19 resilience proven),
(2) Speed-of-service competitive advantage (<3 minute drive-thru target vs Starbucks 5-8 minute customization, working-class customers prioritize speed, efficient throughput maximizes morning rush 7-9am peak capacity),
(3) Mobile ordering integration (DD Perks app 30M+ members, order-ahead pickup eliminates line friction, drive-thru dedicated mobile lanes emerging similar Chipotlane model, digital-first operational evolution),
(4) Real estate footprint flexibility (drive-thru locations require less dine-in seating, smaller square footage possible 1,500-2,000 SF vs traditional 2,500-3,000 SF, lower rent per SF),
(5) Labor efficiency optimization (drive-thru + mobile reduces counter service labor, 15-20% fewer front-line employees vs dine-in heavy format, operational cost advantage franchisee profitability).
Drive-thru critical implications:
(1) Non-drive-thru locations underperform 30-40% (inline strip mall without drive-thru struggles, dine-in coffee shop format inferior economics vs drive-thru convenience, investors MUST avoid non-drive-thru),
(2) Traffic count dependency (drive-thru requires 20,000+ daily vehicles minimum, high-traffic corridors essential visibility/access, vs inline strip mall 10,000 VPD sufficient foot traffic),
(3) Format evolution risk (older 1990s-2000s Dunkin’ inline strip mall format obsolete, modern drive-thru standard 2015+, avoid dated non-drive-thru buildings unless major renovation planned),
(4) Resale value premium (drive-thru Dunkin’ trades 25-50 bps lower caps vs non-drive-thru, investors pay premium superior format, exit liquidity stronger).
Drive-thru vs non-drive-thru Dunkin’ performance:
| Format | % Dunkin’ Locations | AUV | Sales Mix | Investment Preference |
|---|---|---|---|---|
| Drive-thru freestanding | 60-70% (modern standard!) | $1.2-1.4M (premium!) | 75-80% drive-thru/mobile | TARGET (superior economics!) |
| Drive-thru endcap | 15-20% | $1.0-1.2M | 70% drive-thru | Accept (drive-thru present) |
| Inline strip mall NO drive-thru | 10-15% (declining!) | $700K-900K (weak!) | 60% dine-in | AVOID (inferior format!) |
| Urban walk-up | 5-10% (NYC/Boston) | $800K-1.0M | 70% walk-up | Accept (urban only, rare NNN) |
Why drive-thru format CRITICAL (investor perspective):
- 30-40% AUV premium: Drive-thru $1.2-1.4M vs inline $700K-900K (stronger rent coverage, franchisee profitability supports lease payments)
- Pandemic-proof resilience: COVID-19 drive-thru locations maintained 90-95% sales (vs inline dine-in 50-60% collapse, off-premise essential)
- Resale value: Drive-thru properties trade 25-50 bps lower caps (investors pay premium superior format, exit liquidity stronger)
- Future-proof: Dunkin’ prioritizes drive-thru new construction (modern standard, vs inline strip mall format declining obsolete)
Due diligence checklist (verify drive-thru format!):
- Aerial photos: Google Maps satellite view confirms drive-thru lane wrapping building
- Offering memorandum: Broker listing mentions “drive-thru” explicitly (if absent, RED FLAG!)
- Site visit: Physical inspection verifies lane configuration, menu boards, pickup windows
- Sales verification: Request AUV breakdown (drive-thru locations $1.2-1.4M, inline $700K-900K, confirm)
- Avoid inline strip mall: Unless urban walk-up NYC/Boston format (rare, institutional buyers only)
Investment strategy: TARGET drive-thru locations EXCLUSIVELY (verify aerial photos, offering memorandum mentions drive-thru, 30-40% AUV premium = stronger rent coverage + resale value + future-proof format, AVOID inline strip mall non-drive-thru inferior economics).
4. Multi-Unit Franchisee Strength — Avoid Single-Unit Mom-and-Pop Risk!
Dunkin’ Donuts operates 99% franchised model requiring critical franchisee due diligence differentiate experienced multi-unit operators from risky single-unit mom-and-pop:
(1) Multi-unit operators 10-30+ stores (scale economies purchasing/management, professional operations, financial strength support lease obligations, vs single-unit undercapitalized risk),
(2) Franchisee financial statements verification (request 3 years tax returns, P&L statements, balance sheets, confirm $150K-250K EBITDA per store healthy profitability, vs struggling operators break-even/losses),
(3) Years in Dunkin’ system experience (10+ years preferred, proven track record, understand brand operational requirements, vs new franchisees 0-3 years learning curve higher failure risk),
(4) Store count growth trajectory (multi-unit operators acquiring 2-5 stores annually indicates success, expanding footprint, vs stagnant/declining store count RED FLAG financial stress),
(5) Dunkin’ franchisee association membership (DDIFO = Dunkin’ Donuts Independent Franchise Owners, members typically sophisticated multi-unit, advocacy involvement indicates engaged professional operators).
Multi-unit franchisee advantages:
(1) Economies of scale (10+ stores bulk purchasing power food/supplies, centralized management reduces overhead, professional staff HR/accounting/marketing vs owner-operated single-unit),
(2) Financial strength ($5M-20M+ portfolio value, access to capital lines of credit, withstand temporary sales declines individual stores, vs single-unit operator lives paycheck-to-paycheck),
(3) Exit liquidity (multi-unit operators sell stores to other franchisees frequently, lease assumption easier institutional buyers, vs single-unit operator bankruptcy = landlord stuck re-tenanting),
(4) Brand reputation protection (Dunkin’ corporate monitors multi-unit operators closely, operational audits, maintain quality standards, vs single-unit mom-and-pop quality inconsistent risks brand damage).
Franchisee risk tiers (critical due diligence!):
| Franchisee Type | Store Count | Experience | Financial Strength | Investment Risk |
|---|---|---|---|---|
| Institutional multi-unit | 50-200+ stores (best!) | 20+ years Dunkin’ system | $50M-200M+ portfolio value | LOWEST (target!) |
| Regional multi-unit | 10-50 stores | 10-20 years | $10M-50M portfolio | LOW (acceptable) |
| Small multi-unit | 3-10 stores | 5-10 years | $3M-10M portfolio | MODERATE (verify financials) |
| Single-unit mom-and-pop | 1-2 stores | 0-5 years (new!) | $500K-2M (weak!) | HIGH (AVOID!) |
How to verify franchisee strength (due diligence process):
1. Request franchisee information:
- Operating entity: LLC name (e.g., “Smith Family Donuts LLC” vs “ABC Restaurant Group Inc.” institutional)
- Principal owners: Names, backgrounds, years in Dunkin’ system
- Total store count: How many Dunkin’ locations operator owns (10+ preferred, 50+ ideal, 1-2 AVOID)
- Portfolio locations: List of all stores (verify concentration risk, geographic diversification)
2. Financial statement analysis:
- Request 3 years: Tax returns, P&L statements, balance sheets (professional multi-unit operators provide, single-unit resists RED FLAG)
- Store-level EBITDA: $150K-250K per location healthy (10-15% margins), <$100K weak, <$50K failing
- Debt service coverage: EBITDA / debt payments >1.5x (indicates financial cushion, <1.2x overleveraged risk)
- Working capital: $100K-200K per store liquidity (withstand temporary sales declines, <$50K cash-starved risk)
3. Dunkin’ franchise agreement review:
- Years remaining: 10+ years preferred (franchisee incentivized maintain, <5 years may not renew)
- Renewal options: 2-3x 10-year renewals typical (franchisee committed long-term, vs no renewals exit strategy)
- Transfer restrictions: Dunkin’ approval required sell store (protects landlord, new franchisee vetted, vs free transfer risky operators)
- Default provisions: Dunkin’ can terminate poor operators (protects brand quality, landlord benefits well-run stores)
4. Dunkin’ corporate feedback (if accessible):
- Franchisee reputation: Some brokers maintain Dunkin’ corporate relationships (can verify franchisee good standing, operational audits passed)
- Growth trajectory: Is franchisee acquiring new stores? (Indicates success, Dunkin’ approves expansion only strong operators)
- Violation history: Health code violations, operational audits failed (RED FLAGS, avoid troubled operators)
Why multi-unit franchisee matters (investor perspective):
- Lease payment security: Multi-unit operators $10M-50M portfolio value = financial strength (vs single-unit $500K-2M undercapitalized)
- Rent coverage stronger: 10+ stores economies scale = 12-15% store-level margins (vs single-unit 8-10%, tighter rent coverage)
- Exit liquidity: Multi-unit operators sell stores frequently (lease assumption easier, vs single-unit bankruptcy = landlord re-tenanting burden)
- Operational quality: Professional management maintains brand standards (vs mom-and-pop inconsistent quality risks brand damage)
Investment strategy: TARGET multi-unit franchisees 10+ stores exclusively (request store count, financial statements, verify $150K-250K EBITDA per store, 10+ years Dunkin’ experience, AVOID single-unit mom-and-pop undercapitalized high-default risk).
5. Northeast Stronghold Legacy — Boston Heritage 9,000+ US Stores

Dunkin’ Donuts dominates Northeast/East Coast corridor with generational brand loyalty creating geographic concentration advantages:
(1) Boston 1950 founding heritage (“America runs on Dunkin’” cultural identity, New England working-class pride, generational loyalty 70+ years, vs Starbucks Seattle 1971 West Coast origins),
(2) Northeast 50%+ store concentration (Massachusetts 1,000+ stores, New York 1,300+, New Jersey 800+, Pennsylvania 500+, regional saturation density advantages, vs Starbucks urban scattered),
(3) Market density fortressing (Dunkin’ saturates suburbs 1-2 mile radius multiple locations, local monopoly effect, convenience cannibalization minimal, vs competitors 5-10 mile spacing),
(4) East Coast expansion Mid-Atlantic/Southeast (Florida 900+ stores, Georgia 400+, Carolinas 600+, corridor I-95 penetration, vs West Coast underindexed California 200 stores only),
(5) West Coast growth runway (California 200 stores vs potential 2,000+, Texas 400 vs potential 1,500+, South/West underindexed opportunity Inspire Brands capital expansion, vs Northeast saturated mature).
Geographic advantages:
(1) Northeast rent coverage strongest (Massachusetts $1.3-1.5M AUV, New York $1.2-1.4M, brand loyalty + density supports premium performance, vs West Coast $900K-1.1M lower brand awareness),
(2) Delivery economics density (Northeast Dunkin’ 1-2 mile radius saturates = DoorDash/Uber Eats 5-10 minute delivery profitable, vs scattered West Coast 20-30 minute uneconomical),
(3) Real estate availability (Northeast landlords understand Dunkin’ value, institutional familiarity, vs West Coast landlords underestimate credit Starbucks bias),
(4) Exit liquidity regional (Northeast investors compete Dunkin’ acquisitions, vs West Coast buyers unfamiliar brand undervalue).
Geographic store density & AUV performance:
| Region | Store Count | % Total US | Avg AUV | Brand Strength | Investment Appeal |
|---|---|---|---|---|---|
| Northeast (MA/NY/NJ/PA/CT/RI) | 4,500+ (50%!) | 50% | $1.2-1.5M | Dominant (generational loyalty!) | HIGHEST (target!) |
| Mid-Atlantic (MD/VA/DC) | 800+ | 9% | $1.1-1.3M | Strong | High |
| Southeast (FL/GA/NC/SC) | 1,500+ | 17% | $1.0-1.2M | Growing | Moderate-High |
| Midwest (IL/OH/MI) | 1,200+ | 13% | $900K-1.1M | Moderate | Moderate |
| South (TX) | 400+ | 4% | $800K-1.0M | Developing | Growth potential |
| West Coast (CA) | 200+ (2%!) | 2% | $700K-900K (weak!) | Low awareness | AVOID (brand unfamiliar) |
Why Northeast concentration matters (investor perspective):
- Brand loyalty premium: Northeast $1.2-1.5M AUV (vs West Coast $700K-900K, 40-60% stronger sales support rent coverage)
- Density advantages: 1-2 mile saturation = delivery economics + convenience monopoly (vs scattered 10-20 mile spacing weak)
- Exit liquidity: Northeast investors compete Dunkin’ (institutional familiarity, vs West Coast unfamiliar Starbucks market undervalue)
- Recession resilience: Northeast working-class demographics maintained COVID-19 routines (essential workers, vs West Coast tech white-collar vulnerable work-from-home)
Risks to acknowledge:
- Northeast saturation limits growth: 50% stores already Northeast (mature market, minimal expansion runway, vs South/West growth potential)
- Regional economic vulnerability: Northeast recession exposure (vs national diversification Starbucks/McDonald’s, if New England economy struggles concentrated impact)
- Real estate cost premium: Northeast land/rent expensive (Manhattan/Boston Dunkin’ high occupancy cost, vs South/West cheaper real estate)
Investment strategy: TARGET Northeast/Mid-Atlantic/Southeast corridor exclusively (Massachusetts/New York/New Jersey/Florida strong brand loyalty, $1.2-1.5M AUV, density advantages, AVOID West Coast California weak $700K-900K brand unfamiliarity inferior economics).
Dunkin’ Donuts Financial Performance & Inspire Brands Ownership

Dunkin’ Brands History → Inspire Brands Acquisition (2020 $11.3B Private Equity Buyout)
Corporate structure evolution:
- 1950-2006: Private family ownership (Bill Rosenberg founder, New England heritage)
- 2006-2020: Public company (NASDAQ: DNKN, $7B-9B market cap, franchised model 99% operator-owned)
- 2020-present: Inspire Brands subsidiary (Roark Capital private equity $11.3B acquisition, taken private, portfolio integration)
Inspire Brands (current parent company):
- Ownership: Roark Capital private equity (Atlanta-based, $35B+ AUM, restaurant/retail focus)
- Portfolio brands: Dunkin’, Baskin-Robbins, Arby’s, Buffalo Wild Wings, Sonic Drive-In, Jimmy John’s, Rusty Taco, Mister Donut, Schlotzsky’s (32,000+ restaurants globally, $30B+ system sales)
- Scale advantages: Institutional resources technology, marketing, supply chain, real estate, vs standalone Dunkin’ Brands limited capital
- Strategic focus: Drive-thru + digital + off-premise optimization (COVID-19 accelerated, Inspire portfolio-wide initiatives)
Financial performance (Dunkin’ segment 2020-2024):
- US system sales: $10-11B annually (9,000+ stores × $1.1M AUV average)
- Store count: 9,000+ US, 13,000+ globally (international Baskin-Robbins combo units common)
- Same-store sales: +3-5% annually 2021-2023 (COVID-19 recovery, inflation pricing power, traffic +1-2% + ticket +2-3%)
- New openings: 200-300 net new stores/year US (vs closures 100-150/year older inline locations, drive-thru remodels/relocations)
- Franchisee profitability: $150K-250K EBITDA per store average (10-15% margins, healthy rent coverage 6-8% rent-to-sales)
Inspire Brands ownership implications (investor perspective):
Advantages:
- Capital resources scale: Private equity $35B+ portfolio access (vs public company quarterly earnings pressure, Inspire long-term investment horizon)
- Technology investment acceleration: Mobile ordering DD Perks integration, drive-thru digital menu boards, kitchen automation (Inspire portfolio-wide technology platforms scale)
- Real estate strategy optimization: Drive-thru prioritization, inline closure/relocations, new construction formats modernization (Inspire portfolio real estate expertise Arby’s/BWW/Sonic drive-thru experience)
- Supply chain efficiencies: Inspire portfolio purchasing scale 32,000 restaurants (cost savings Dunkin’ franchisees benefit lower COGS)
Risks:
- Private company opacity: No quarterly public earnings reports (vs DNKN 2006-2020 transparent financials, Inspire private limited disclosure)
- Debt leverage: Private equity $11.3B acquisition debt-financed (Inspire portfolio $8-10B debt, interest burden, vs public company minimal debt)
- Portfolio priority shifts: Inspire focuses Arby’s/BWW growth (Dunkin’ potentially lower priority vs flagship brands, capital allocation questions)
- Brand identity dilution: Inspire portfolio integration (Dunkin’ “America runs on Dunkin’” distinct identity, vs corporate synergy risk generic private equity roll-up)
Investment decision: Inspire Brands ownership = institutional backing scale advantages (capital resources, technology, real estate expertise, BUT private company opacity + debt leverage + portfolio priority uncertainties, neutral net impact, franchise model insulates individual stores from corporate financial stress).
Dunkin’ Donuts Franchisee Economics (Store-Level Profitability)
Average unit economics (typical drive-thru location):
- AUV: $1.1-1.3M annually (drive-thru freestanding, Northeast/Mid-Atlantic, moderate traffic)
- Gross margin: 60-65% ($660K-845K gross profit after COGS 35-40% food/beverage/packaging)
- Labor: 25-30% ($275K-390K wages/benefits, ~10-12 employees FTE)
- Occupancy: 6-8% ($66K-104K rent triple net, CAM, real estate taxes, landlord costs)
- Other operating: 15-18% ($165K-234K utilities, marketing, royalties, supplies, insurance)
- Store-level EBITDA: 10-15% ($110K-195K, franchisee profit before debt service/taxes/depreciation)
Strong vs weak unit economics comparison:
| Factor | Strong Drive-Thru | Weak Inline Strip Mall | Difference |
|---|---|---|---|
| AUV | $1.3-1.5M (Northeast) | $700K-900K | +40-60% (drive-thru premium!) |
| Gross margin | 62-65% ($806K-975K) | 58-60% ($406K-540K) | Higher volume = margin leverage |
| Labor % | 25-27% (efficient) | 30-32% (overstaffed) | Drive-thru optimized |
| Occupancy % | 6-7% ($78K-105K) | 8-10% ($56K-90K) | Rent-to-sales healthy |
| EBITDA | $165K-225K (12-15%) | $70K-110K (8-10%) | $100K advantage! |
| Rent coverage | 6-7% rent-to-sales | 8-10% (tight!) | Drive-thru stronger! |
Why franchisee economics matter (investor perspective):
- Rent coverage security: Strong drive-thru $1.3M AUV supports $80K-100K rent (6-7% rent-to-sales healthy, franchisee profits $165K-225K EBITDA)
- Weak inline risk: $700K AUV struggles $60K-80K rent (8-10% rent-to-sales tight, franchisee profits $70K-110K marginal, default risk higher)
- Multi-unit scale: 10+ store operators achieve 12-15% margins (vs single-unit 8-10%, economies scale purchasing/management)
- Verify in due diligence: Request franchisee financial statements (confirm $150K-250K EBITDA per store, if <$100K RED FLAG weak economics)
Investment strategy: Verify franchisee profitability $150K-250K EBITDA per store (request 3 years financial statements, drive-thru format $1.2-1.4M AUV = healthy rent coverage, avoid inline weak $700K-900K AUV marginal economics high-default risk).
Drive-Thru Format Critical Importance — Verify Before Purchase
Why Drive-Thru Format NON-NEGOTIABLE (30-40% AUV Premium)
Drive-thru locations fundamentally outperform inline strip mall format:
1. Sales performance differential:
- Drive-thru freestanding: $1.2-1.4M AUV (70-80% sales off-premise)
- Drive-thru endcap: $1.0-1.2M AUV (60-70% off-premise)
- Inline strip mall NO drive-thru: $700K-900K AUV (30-40% LOWER!)
- Urban walk-up: $800K-1.0M AUV (dense foot traffic NYC/Boston only)
2. Operational advantages:
- Speed-of-service: Drive-thru <3 min target (morning rush 7-9am critical, mobile order pickup efficient)
- Labor efficiency: 15-20% fewer employees (vs inline dine-in counter service labor-intensive)
- Pandemic resilience: COVID-19 drive-thru maintained 90-95% sales (inline dine-in 50-60% collapse)
3. Real estate economics:
- Smaller footprint: 1,500-2,000 SF (vs inline 2,500-3,000 SF dine-in seating requirement)
- Higher sales per SF: $700-800 PSF (vs inline $300-400 PSF, 2x efficiency)
- Land requirements: 0.5-1 acre pad site (drive-thru lane, parking, access)
4. Consumer behavior alignment:
- Morning convenience: 70%+ customers drive-thru (grab-and-go speed, vs walk-in 5-8 minute experience)
- Mobile ordering: DD Perks app integration (order ahead pickup, dedicated drive-thru lanes emerging)
- Work-from-home resilient: Remote workers drive Dunkin’ coffee runs (vs eliminating walk-in downtown urban locations)
Drive-Thru Verification Checklist (CRITICAL Due Diligence)
Before purchasing ANY Dunkin’ NNN property, verify drive-thru format:
1. Aerial photography review:
- Google Maps satellite view: Zoom in, identify drive-thru lane wrapping building (distinct U-shape or L-shape lane configuration)
- Verify menu boards: Two menu board locations typical (pre-order board + confirmation board before pickup window)
- Parking layout: Drive-thru locations have 15-25 parking spaces (vs inline 30-50 spaces dine-in emphasis)
2. Offering memorandum analysis:
- Description: Broker listing MUST mention “drive-thru” explicitly (if absent, ASK broker confirm format!)
- Photos: OM includes drive-thru lane images (menu boards, pickup windows visible)
- Sales data: AUV disclosed $1.0M-1.4M indicates drive-thru (if $700K-900K likely inline weak)
3. Site visit physical inspection:
- Drive-thru lane: Walk around building, verify lane configuration (not just parking lot, dedicated lane wraps building)
- Menu boards: Identify pre-order board, confirmation board (drive-thru standard equipment)
- Pickup windows: 1-2 windows typical (payment window, pickup window, vs inline no windows)
- Signage: Drive-thru directional signs, mobile order pickup lane designation
4. Franchise agreement review:
- Permitted use: “Quick service restaurant with drive-thru” (vs “retail food service” generic inline)
- Operating hours: Extended hours 5am-10pm typical drive-thru (vs inline 6am-8pm shorter)
- Remodel requirements: Dunkin’ may require drive-thru addition (if inline format, verify franchisee obligation add drive-thru or landlord cost)
5. Sales verification (if available):
- Request AUV breakdown: Drive-thru locations $1.2-1.4M (vs inline $700K-900K, 40-60% premium confirms format)
- Off-premise %: Drive-thru 70-80% sales off-premise (vs inline 40-50%, confirms drive-thru dominant)
- Morning peak: 7-9am sales 35-40% daily total (drive-thru optimized morning rush, vs inline 25-30%)
What If Property is Inline Strip Mall WITHOUT Drive-Thru?
RED FLAG — Avoid unless exceptional circumstances:
Risks of inline non-drive-thru format:
- 30-40% lower AUV: $700K-900K (vs drive-thru $1.2-1.4M, weaker rent coverage)
- Rent-to-sales tight: 8-10% (vs drive-thru 6-7% healthy, higher default risk)
- Franchisee profitability weak: $70K-110K EBITDA (vs drive-thru $165K-225K, marginal economics)
- Pandemic vulnerability: Inline collapsed COVID-19 (50-60% sales decline, vs drive-thru resilient 5-10% only)
- Obsolete format: Dunkin’ prioritizes drive-thru new construction (inline declining, franchisees reluctant renew leases)
- Resale difficulty: Investors avoid inline (limited buyer pool, lower exit liquidity, may need discount 50-100 bps cap to sell)
Exceptions (inline MAY be acceptable IF):
- Dense urban walk-up: Manhattan, Boston, Philadelphia downtown (foot traffic 20,000+ daily, walk-in customers primary)
- Major shopping center anchor: Regional mall or lifestyle center (co-tenancy Macy’s/Target/Whole Foods, captive traffic)
- University campus location: College 10,000+ students (captive walk-in audience, food court format)
- Verified strong sales: AUV $1.0M+ documented (exceptional inline performance, rare but possible)
- Drive-thru addition planned: Landlord/franchisee committed retrofit (verify written obligation, timeline, cost responsibility)
Investment strategy: TARGET drive-thru locations ONLY (verify aerial photos, OM mentions drive-thru, 30-40% AUV premium = $1.2-1.4M vs inline $700K-900K, stronger rent coverage + pandemic-proof + future-proof format, AVOID inline strip mall except dense urban walk-up rare exceptions).
Key Markets for Dunkin’ Donuts NNN Investment
Dunkin’ concentrates Northeast/East Coast corridor strength with expansion runway South/West creating geographic investment strategy:
1. Massachusetts: 1,000+ Stores (Boston Heritage Stronghold)
Why Massachusetts dominant:
- Store count: 1,000+ Dunkin’ (Boston metro 400+, Worcester 50+, Springfield 40+, Cape Cod 100+)
- Brand birthplace: Quincy 1950 first location (generational loyalty 70+ years, cultural identity “Mass runs on Dunkin’”)
- Density saturation: 1-2 mile radius multiple stores (every town >5,000 population has Dunkin’, convenience monopoly)
- AUV premium: $1.3-1.5M Massachusetts average (highest US, brand loyalty + density + affluent suburbs support)
Massachusetts Dunkin’ investment profile:
- Cap rates: 5.75-6.25% (Northeast premium pricing, institutional competition, lower yields reflect brand strength)
- Price range: $2M-3.5M (expensive real estate, drive-thru freestanding prime corridors)
- Franchisee quality: Multi-unit operators 10-50+ stores typical (professional management, financial strength)
- Exit liquidity: Highest US (Massachusetts investors compete, institutional familiarity, quick sales)
Top submarkets: Greater Boston (Newton, Brookline, Cambridge, Quincy), North Shore (Salem, Peabody, Danvers), South Shore (Plymouth, Braintree), Cape Cod (Hyannis, Falmouth summer seasonal strong)
2. New York: 1,300+ Stores (Largest State Footprint)
Why New York significant:
- Store count: 1,300+ Dunkin’ (Long Island 400+, NYC 300+, Westchester 150+, Upstate 450+)
- Suburban penetration: Long Island/Westchester working-class commuter density (vs Starbucks Manhattan urban focus)
- Upstate critical mass: Buffalo, Rochester, Syracuse, Albany 50-100 stores each (smaller cities Dunkin’ dominates vs Starbucks limited)
- AUV range: $1.2-1.4M downstate, $1.0-1.2M upstate (suburban Long Island premium, upstate moderate)
New York Dunkin’ investment profile:
- Cap rates: 6.0-6.5% (New York commercial real estate premium, but abundant supply vs Massachusetts scarcity)
- Price range: $2M-4M NYC metro, $1.5M-2.5M upstate (expensive downstate land, moderate upstate)
- Franchisee concentration: Large multi-unit 20-100+ stores common (institutional scale operators Long Island/Westchester)
- Exit liquidity: High (institutional buyer pool, franchise community active)
Top submarkets: Long Island (Nassau/Suffolk counties), Westchester County, Hudson Valley, Buffalo metro, Rochester metro
3. Florida: 900+ Stores (Southeast Growth Market)
Why Florida important:
- Store count: 900+ Dunkin’ (South Florida 400+, Orlando 200+, Tampa 150+, Jacksonville 100+)
- Northern transplants: Northeast retirees/relocations maintain Dunkin’ loyalty (vs Starbucks unfamiliar)
- Growth trajectory: +50-100 net new stores/year (Inspire Brands expansion focus, vs Northeast saturation mature)
- AUV moderate: $1.0-1.2M Florida average (brand awareness growing, not yet Massachusetts $1.3-1.5M premium)
Florida Dunkin’ investment profile:
- Cap rates: 6.25-6.75% (growth market premium, but hurricane insurance adds cost)
- Price range: $1.8M-3M South Florida, $1.5M-2.5M Orlando/Tampa (cheaper than Northeast real estate)
- Franchisee mix: Mix regional multi-unit 10-30 stores + Northeast transplants expanding South
- Hurricane risk: Wind mitigation insurance +$15K-20K/year (absolute NNN tenant-paid, but factor cost)
Top submarkets: South Florida (Miami, Fort Lauderdale, West Palm Beach), Orlando metro (tourist + residential), Tampa/St. Pete, Jacksonville
4. New Jersey: 800+ Stores (Commuter Corridor Density)
Why New Jersey strategic:
- Store count: 800+ Dunkin’ (Northern NJ 500+, Central 200+, Shore 100+)
- NYC commuter density: Bergen/Essex/Hudson counties working-class (morning coffee commute routine strong)
- Route corridor penetration: I-95, Garden State Parkway, Turnpike (highway visibility drive-thru optimized)
- AUV strong: $1.2-1.4M Northern NJ (NYC metro proximity, affluent suburbs, traffic density)
New Jersey Dunkin’ investment profile:
- Cap rates: 6.0-6.5% (commuter markets institutional demand, competitive pricing)
- Price range: $2M-3.5M Northern NJ, $1.8M-2.8M Central/Shore (expensive NYC metro, moderate elsewhere)
- Franchisee quality: Multi-unit 10-50+ stores (professional operators, NYC metro sophisticated)
- Exit liquidity: High (institutional investors, franchise community active)
Top submarkets: Bergen County (Paramus, Hackensack), Essex County (Newark, Bloomfield), Monmouth County (Shore summer seasonal)
5. Pennsylvania: 500+ Stores (Philadelphia + Pittsburgh Anchors)
Why Pennsylvania relevant:
- Store count: 500+ Dunkin’ (Philadelphia metro 300+, Pittsburgh 100+, Lehigh Valley 50+)
- Philadelphia working-class: Blue-collar demographics Dunkin’ value positioning ideal (vs Starbucks limited penetration)
- Pittsburgh growth: Recent expansion 2010s (brand awareness building, vs Philadelphia mature 1990s)
- AUV range: $1.1-1.3M Philadelphia, $900K-1.1M Pittsburgh (Philadelphia stronger brand loyalty)
Pennsylvania Dunkin’ investment profile:
- Cap rates: 6.25-6.75% (moderate demand, less competitive than Massachusetts/New York)
- Price range: $1.8M-2.8M Philadelphia, $1.5M-2.3M Pittsburgh (moderate real estate costs)
- Franchisee mix: Regional multi-unit 10-30 stores (professional but smaller scale than NYC/Boston)
- Exit liquidity: Moderate (regional investor pool, franchise buyers active)
Top submarkets: Philadelphia suburbs (Montgomery, Delaware, Chester counties), Pittsburgh suburbs (Allegheny, Butler), Lehigh Valley (Allentown, Bethlehem)
How to Evaluate Dunkin’ Donuts NNN Properties
1. CRITICAL: Verify Drive-Thru Format (30-40% AUV Premium)
Most important due diligence (drive-thru vs inline non-drive-thru):
Drive-thru format verification (see detailed section above):
- Aerial photos: Google Maps confirms drive-thru lane wrapping building
- Offering memorandum: Broker listing mentions “drive-thru” explicitly
- Site visit: Physical inspection verifies lane, menu boards, pickup windows
- Sales data: AUV $1.2-1.4M indicates drive-thru (vs $700K-900K inline weak)
Investment decision: TARGET drive-thru locations EXCLUSIVELY (30-40% AUV premium $1.2-1.4M vs inline $700K-900K, stronger rent coverage, pandemic-proof, future-proof format, AVOID inline strip mall non-drive-thru except dense urban walk-up rare exceptions).
2. Verify Multi-Unit Franchisee Strength (10+ Stores Preferred)
Franchisee due diligence (see detailed section above):
Request franchisee information:
- Store count: How many Dunkin’ locations operator owns (10+ preferred, 50+ ideal, 1-2 AVOID)
- Years in system: 10+ years experience preferred (vs 0-3 years new franchisee learning curve risk)
- Financial statements: 3 years tax returns, P&L, balance sheets (verify $150K-250K EBITDA per store)
- Geographic diversification: Multiple markets vs single-market concentration (risk mitigation)
Franchisee red flags (AVOID these):
- Single-unit operator: 1-2 stores only (undercapitalized, mom-and-pop high-default risk)
- New franchisee: <3 years Dunkin’ system (learning curve, operational inexperience)
- Weak financials: <$100K EBITDA per store (struggling operations, tight rent coverage)
- Declining store count: Operator selling stores/closing locations (financial distress signal)
- Litigation history: Lawsuits with Dunkin’ corporate, landlords, employees (operational problems)
Investment strategy: TARGET multi-unit franchisees 10+ stores (request operator information, financial statements, verify $150K-250K EBITDA healthy profitability, 10+ years experience, AVOID single-unit mom-and-pop undercapitalized high-default risk).
3. Assess Location Quality & Traffic
Site location criteria:
- Traffic counts: 20,000+ daily vehicles minimum (drive-thru requires high-traffic corridors, vs inline 10,000 VPD sufficient)
- Visibility: Road-fronting signage (Dunkin’ prominent, not hidden behind buildings)
- Access: Easy ingress/egress (dedicated turn lanes, traffic light preferred, multiple entry points)
- Drive-thru configuration: Lane wraps building efficiently (not awkward tight turns, smooth traffic flow)
Demographic assessment:
- Population density: 30,000+ residents 5-mile radius (coffee + breakfast needs critical mass, vs 75K+ Chipotle premium)
- Median income: $55K-85K (working-class sweet spot, vs $35K-55K too low, $85K+ Starbucks preference)
- Age demographics: Mix 25-65 working-age adults (morning coffee commute routine, vs retirees less frequent)
- Employment density: Business parks, hospitals, schools nearby (daytime population coffee demand)
Competitive landscape:
- Starbucks proximity: 2-3 mile radius acceptable (Dunkin’ value positioning differentiated, minimal cannibalization)
- McDonald’s McCafé: Direct competition $1-3 coffee (price pressure, but Dunkin’ quality perception superior)
- Other Dunkin’ locations: 1-2 mile radius typical (Dunkin’ saturates markets, cannibalization minimal brand loyalty)
- Regional coffee chains: Tim Hortons (Canada), Dutch Bros (West Coast), local independent (assess market share threats)
Investment implications:
- Target commuter corridors: Highway exits, major arterials 20,000+ VPD (morning commute coffee runs critical traffic)
- Verify drive-thru visibility: Road-fronting signage (vs behind buildings, poor visibility reduces sales)
- Working-class demographics: $55K-85K median income (Dunkin’ value sweet spot, recession-resilient, avoid $35K-55K too low or $85K+ Starbucks preference)
4. Analyze Lease Terms & Rent Escalations
Key lease provisions:
- Lease type: Absolute NNN (tenant pays ALL expenses, landlord ZERO responsibilities, roof/structure tenant-paid)
- Lease term: 15-20 years initial (verify remaining, 10+ years optimal resale)
- Rent escalations: 10% every 5 years OR 1.5-2% annually (inflation protection, cash flow growth)
- Renewal options: 2-3x 10-year renewals typical (15-20 initial + 20-30 renewals = 35-50 year potential)
- Franchisee guarantee: Multi-unit operator personal guarantee + corporate guarantee (vs single-unit limited personal assets)
- Dunkin’ corporate guarantee: RARE (99% franchised, NOT corporate-guaranteed like Chipotle, franchisee credit only)
Rent escalation preference:
- Target: 10% every 5 years (significant income jumps, 20-30% growth over 15 years)
- Accept: 1.5-2% annual escalations (smoother growth, better inflation hedge, but lower total increase)
- Avoid: Zero escalations (if exists, negotiate significantly lower purchase price compensate fixed income erosion)
Lease term considerations:
- New 2024-2025 lease: 15-20 years full term (optimal, maximum resale value)
- Existing 2015-2018 lease: 10-13 years remaining (acceptable, verify franchisee committed renew)
- Short term <10 years: Verify franchisee renewal commitment (if <10 years + no renewal guarantee, negotiate lower price reflects uncertainty)
5. Geographic Concentration Strategy (Northeast Strong, West Coast Weak)
Northeast/East Coast targeting (highest brand strength):
- Target: Massachusetts, New York, New Jersey, Pennsylvania, Florida (50%+ Dunkin’ store concentration, brand loyalty generational, $1.2-1.5M AUV premium)
- Accept: Mid-Atlantic/Southeast (Maryland, Virginia, Georgia, Carolinas, brand growing, $1.0-1.2M AUV moderate)
- AVOID: West Coast California, Pacific Northwest (weak $700K-900K AUV, brand unfamiliarity, Starbucks dominant, inferior economics)
Why Northeast concentration matters:
- Brand loyalty premium: Massachusetts $1.3-1.5M AUV (vs California $700K-900K, 40-60% stronger rent coverage)
- Density advantages: 1-2 mile saturation = delivery economics + convenience monopoly (vs West Coast scattered 10-20 mile spacing)
- Exit liquidity: Northeast investors compete (institutional familiarity, vs West Coast unfamiliar undervalue)
Investment strategy: TARGET Northeast/East Coast exclusively (Massachusetts/New York/New Jersey/Pennsylvania/Florida strong brand loyalty, $1.2-1.5M AUV, density advantages, AVOID West Coast California weak $700K-900K brand unfamiliarity inferior economics).
Frequently Asked Questions (FAQs)
How does Dunkin’ Donuts compare to Starbucks for NNN investment?
Dunkin’ vs Starbucks comparison reveals different demographic positioning with distinct risk/return profiles:
Key differences (value vs premium):
| Factor | Dunkin’ Donuts | Starbucks | Advantage |
|---|---|---|---|
| Pricing | $3-5 (value!) | $5-8 (premium) | Dunkin’ (working-class recession-resilient) |
| Demographic | Working-class, middle-income | White-collar, upper-income | Dunkin’ (affordable luxury trade-down destination) |
| Store count US | 9,000 locations | 3,000 company-owned | Dunkin’ (accessibility, suburban saturation) |
| Daypart | Morning 80%+ sales | All-day (40% morning, 60% afternoon) | Dunkin’ (breakfast monopoly, coffee-first) |
| Lease guarantee | Franchisee-backed (99%) | Corporate (60% company-owned) | Starbucks (BBB+ credit advantage) |
| Cap rates | 6.0-7.0% | 5.0-6.0% | Dunkin’ (yield advantage 100 bps higher) |
| AUV | $1.1-1.3M average | $1.8-2.2M average | Starbucks (sales volume advantage) |
| Geographic strength | Northeast dominant | National/urban | Dunkin’ (regional loyalty), Starbucks (national brand) |
Dunkin’ advantages:
- Recession resilience: Working-class demographics trade down Starbucks → Dunkin’ (2008 recession Dunkin’ traffic +5-8%, Starbucks -10%)
- Value positioning: $3-5 coffee sustainable working-class budgets (vs $5-8 Starbucks cutting frequency economic stress)
- Yield premium: 6.0-7.0% caps vs Starbucks 5.0-6.0% (100 bps higher income compensates franchisee credit vs corporate guarantee)
- Expansion runway: Dunkin’ underindexed South/West Coast (growth potential, vs Starbucks urban saturation)
Starbucks advantages:
- Corporate guarantee security: 60% company-owned locations (Starbucks Corp BBB+ credit guarantees lease, vs Dunkin’ 99% franchisee-backed individual operator credit)
- Higher AUV: $1.8-2.2M (60-80% premium vs Dunkin’ $1.1-1.3M, stronger sales volume)
- National brand recognition: Coast-to-coast awareness (vs Dunkin’ Northeast concentration, West Coast weak brand)
- Premium pricing power: $5-8 coffee maintains margins (vs Dunkin’ $3-5 value limits pricing flexibility)
Investment decision framework:
Choose Dunkin’ IF:
- Seeking recession-resilient working-class demographics (trade-down destination, affordable luxury maintains frequency)
- Prefer yield advantage (6.0-7.0% caps vs Starbucks 5.0-6.0%, 100 bps higher income)
- Target morning daypart specialization (80%+ breakfast/coffee, vs Starbucks all-day diversified)
- Accept franchisee credit risk (individual operator vs corporate guarantee, due diligence required)
Choose Starbucks IF:
- Prioritize corporate guarantee security (BBB+ credit rating, vs Dunkin’ franchisee-backed individual credit)
- Prefer national brand strength (coast-to-coast recognition, vs Dunkin’ Northeast concentration)
- Accept lower yields (5.0-6.0% caps for corporate guarantee security, vs Dunkin’ 6.0-7.0% franchisee-backed)
- Value higher AUV ($ 1.8-2.2M premium sales, vs Dunkin’ $1.1-1.3M moderate volume)
Portfolio strategy: Buy BOTH (Dunkin’ 40% value/working-class + Starbucks 40% premium/corporate + Chipotle 20% growth = diversified coffee + fast-casual NNN portfolio, demographic/credit/daypart balance).
What’s the biggest risk with Dunkin’ Donuts NNN properties?
Single biggest risk = Franchisee default (99% franchised model, individual operator credit quality varies dramatically, vs corporate-guaranteed Chipotle/McDonald’s zero landlord recourse):
Why franchisee risk matters:
- No corporate backstop: Dunkin’ franchisees individually own/operate stores (vs Chipotle Inc. $80B corporate guarantees lease, if Dunkin’ franchisee bankrupts → landlord loses income immediately, vs Chipotle corporate continues paying rent)
- Financial strength varies: Multi-unit operators 10-50+ stores $10M-50M portfolios strong (vs single-unit mom-and-pop $500K-2M undercapitalized high-default risk)
- Economic stress exposure: Franchisees leverage 70-80% debt typical (2008 recession, COVID-19 many franchisees struggled debt service, vs corporate-owned Starbucks maintained operations)
How to mitigate franchisee default risk:
1. Multi-unit franchisee targeting (10+ stores minimum!):
- Professional operators: 10-50+ stores = $10M-50M portfolio value (financial strength, economies scale, vs single-unit $500K-2M weak)
- Proven track record: 10+ years Dunkin’ system experience (operational knowledge, vs new franchisees 0-3 years learning curve)
- Expansion trajectory: Acquiring 2-5 stores annually indicates success (vs stagnant/declining store count RED FLAG)
2. Financial statement verification (CRITICAL due diligence!):
- Request 3 years: Tax returns, P&L statements, balance sheets (professional multi-unit operators provide, single-unit resists RED FLAG)
- Verify EBITDA: $150K-250K per store healthy (10-15% margins, if <$100K weak, <$50K failing)
- Debt service coverage: EBITDA / debt payments >1.5x (financial cushion, <1.2x overleveraged risk)
- Working capital: $100K-200K per store liquidity (withstand sales declines, <$50K cash-starved risk)
3. Drive-thru format requirement (30-40% AUV premium!):
- Drive-thru freestanding: $1.2-1.4M AUV (70-80% off-premise, pandemic-proof, strong rent coverage)
- AVOID inline strip mall: $700K-900K AUV (30-40% weaker sales, tight rent coverage 8-10% rent-to-sales, higher default risk)
4. Northeast/East Coast geographic focus (brand strength advantage!):
- Massachusetts/New York/New Jersey: $1.2-1.5M AUV (generational brand loyalty, density advantages, stronger franchisee performance)
- AVOID West Coast: California $700K-900K AUV (weak brand awareness, Starbucks dominant, franchisees struggle inferior economics)
5. Rent-to-sales healthy ratio (6-8% maximum!):
- Target: Annual rent ÷ AUV = 6-8% (healthy franchisee profitability, rent coverage secure)
- Acceptable: 8-10% (moderate, verify franchisee financials $150K+ EBITDA)
- AVOID: >10% rent-to-sales (landlord extracting excessive rent, franchisee margins compressed, high-default risk)
Other significant risks:
Starbucks competition intensifying:
- Starbucks expanding 3,000 → 5,000 US stores (pressure Dunkin’ premium customers trade up, but Dunkin’ value moat protects working-class core)
Inspire Brands debt leverage:
- Private equity $11.3B acquisition debt-financed (corporate debt $8-10B, interest burden, vs public DNKN 2006-2020 minimal debt)
- If Inspire struggles: Dunkin’ franchisee support resources may decline (but franchise model insulates individual stores from corporate financial stress)
Brand evolution uncertainty:
- Dunkin’ dropped “Donuts” from name 2019 (coffee-first positioning, BUT donut sales still 20-30% revenue, alienating donut customers risk?)
- Menu complexity creep (espresso drinks, cold brew, specialty beverages increase, operational complexity vs speed-of-service trade-off)
Investment decision: Franchisee default = single biggest risk (mitigate by targeting multi-unit 10+ stores operators, financial statement verification $150K-250K EBITDA per store, drive-thru format $1.2-1.4M AUV, Northeast/East Coast brand strength $1.2-1.5M, 6-8% rent-to-sales healthy ratio, AVOID single-unit mom-and-pop, inline weak AUV, West Coast brand unfamiliar, >10% rent-to-sales).
Should I buy Dunkin’ in Florida or stick to Northeast markets?
Florida = Growth market opportunity with moderate risk/return vs Northeast mature stronghold:
Florida advantages (growth market):
- Store expansion: +50-100 net new stores/year (Inspire Brands expansion focus, vs Northeast saturation mature)
- Northern transplants: Northeast retirees/relocations maintain Dunkin’ loyalty (cultural affinity “America runs on Dunkin’,” vs West Coast Starbucks preference)
- Real estate costs: $1.8M-3M properties (vs Northeast $2M-4M, 10-30% cheaper land/construction)
- Cap rate premium: 6.25-6.75% (vs Northeast 5.75-6.25%, 50-75 bps yield advantage compensates developing brand)
Florida risks:
- Brand awareness developing: $1.0-1.2M AUV Florida (vs Northeast $1.2-1.5M, 15-25% weaker sales reflects growing vs mature market)
- Starbucks competition stronger: Florida more national vs Northeast regional (Starbucks 500+ Florida stores competes, vs Northeast Dunkin’ 4,500 dominates)
- Hurricane exposure: Wind mitigation insurance +$15K-20K/year (absolute NNN tenant-paid, but adds franchisee cost burden)
- Franchisee mix unproven: Mix regional multi-unit + Northeast transplants (less established than Northeast generational operators)
Northeast advantages (mature stronghold):
- Brand loyalty generational: Massachusetts/New York/New Jersey 70+ years (cultural identity “Mass runs on Dunkin’,” recession-resilient)
- AUV premium: $1.2-1.5M Northeast (15-25% stronger than Florida $1.0-1.2M, better rent coverage)
- Density advantages: 1-2 mile saturation (convenience monopoly, delivery economics profitable, vs Florida 5-10 mile spacing)
- Franchisee quality: Multi-unit 10-50+ stores institutional (50+ years combined experience, financial strength, vs Florida newer operators)
- Exit liquidity highest: Northeast investors compete (institutional familiarity, quick sales, vs Florida regional buyer pool smaller)
Northeast risks:
- Saturation limits growth: 4,500+ stores 50% US total (mature market, minimal expansion runway, vs Florida growth 900 → 1,500+ potential)
- Higher prices: $2M-4M properties (vs Florida $1.8-3M, 10-30% premium Northeast real estate expensive)
- Lower cap rates: 5.75-6.25% (vs Florida 6.25-6.75%, 50-75 bps yield sacrifice for brand strength)
Investment decision framework:
Buy Florida IF:
- Seeking growth market exposure (+50-100 stores/year expansion, vs Northeast mature saturation)
- Prefer yield advantage (6.25-6.75% caps vs Northeast 5.75-6.25%, 50-75 bps higher income)
- Accept developing brand risk ($1.0-1.2M AUV vs Northeast $1.2-1.5M, 15-25% weaker sales developing market)
- Target value entry ($1.8M-3M vs Northeast $2M-4M, 10-30% cheaper real estate cost basis)
Buy Northeast IF:
- Prioritize brand loyalty strength ($1.2-1.5M AUV generational loyalty, vs Florida $1.0-1.2M developing)
- Prefer mature market stability (4,500+ stores density, recession-tested 70+ years, vs Florida growth uncertainty)
- Value exit liquidity (highest US, institutional investors compete, quick sales, vs Florida regional buyer pool)
- Accept lower yields (5.75-6.25% caps premium pricing, vs Florida 6.25-6.75% growth market higher risk)
Portfolio strategy: Buy BOTH 50/50 (Northeast 50% mature stability + Florida 50% growth exposure = balanced Dunkin’ portfolio, geographic diversification Northeast saturation + Florida expansion mitigates single-market concentration risk).
How important is drive-thru format for Dunkin’ NNN investment?
CRITICAL — Drive-thru format NON-NEGOTIABLE providing 30-40% AUV premium, pandemic-proof operations, and superior exit liquidity:
Drive-thru vs inline strip mall performance differential:
| Metric | Drive-Thru Freestanding | Inline Strip Mall NO Drive-Thru | Difference |
|---|---|---|---|
| AUV | $1.2-1.4M | $700K-900K | +40-60% (drive-thru premium!) |
| Rent coverage | 6-7% rent-to-sales | 8-10% (tight!) | Drive-thru healthier 200-300 bps! |
| Franchisee EBITDA | $165K-225K (12-15%) | $70K-110K (8-10%) | Drive-thru $100K advantage! |
| Off-premise sales | 70-80% | 40-50% | Drive-thru pandemic-proof! |
| COVID-19 resilience | 90-95% sales maintained | 50-60% (collapsed!) | Drive-thru crisis-resistant! |
| Cap rates | 6.0-6.5% | 6.75-7.25% | Drive-thru 50-75 bps premium pricing! |
| Exit liquidity | Strong (investors compete) | Weak (limited buyers) | Drive-thru higher resale value! |
Why drive-thru format CRITICAL:
1. Sales performance ($500K+ incremental revenue!):
- Drive-thru locations generate $1.2-1.4M AUV (40-60% premium vs inline $700K-900K)
- Morning convenience 70-80% customers drive-thru (grab-and-go speed, vs walk-in 20-30% slower)
- Working-class demographics prefer drive-thru (convenience, time-sensitive morning commute)
2. Rent coverage security (2-3% stronger!):
- Drive-thru 6-7% rent-to-sales (healthy franchisee profitability, secure rent payments)
- Inline 8-10% rent-to-sales (tight margins, higher default risk franchisee struggles)
- Drive-thru franchisees profit $165K-225K EBITDA (vs inline $70K-110K marginal, $100K advantage!)
3. Pandemic resilience (40% sales advantage COVID-19!):
- Drive-thru maintained 90-95% sales COVID-19 (off-premise operational model)
- Inline collapsed 50-60% (dine-in closures, customers avoided walk-in, vs drive-thru safe contactless)
- Future pandemics/crises: Drive-thru format proven resilient (vs inline vulnerable repeat)
4. Exit liquidity advantage (investors compete drive-thru!):
- Drive-thru properties trade 25-50 bps lower caps (investors pay premium superior format)
- Inline limited buyer pool (investors avoid inferior economics, may need 6.75-7.25% caps vs drive-thru 6.0-6.5%)
- Resale speed: Drive-thru sells 30-60 days (institutional competition, vs inline 90-180 days struggle)
5. Future-proof investment (Dunkin’ prioritizes drive-thru!):
- 70%+ new Dunkin’ construction drive-thru format (modern standard 2015+, inline declining obsolete)
- Franchisees reluctant renew leases inline (prefer relocate drive-thru, landlord re-tenanting risk)
- Drive-thru format aligns consumer behavior (off-premise preference, mobile ordering growth, dine-in declining)
How to verify drive-thru format (due diligence checklist):
- Aerial photos: Google Maps satellite view (drive-thru lane wraps building U-shape/L-shape)
- Offering memorandum: Broker listing mentions “drive-thru” explicitly (if absent RED FLAG ask confirm!)
- Site visit: Physical inspection (drive-thru lane, menu boards, pickup windows verified)
- Sales verification: AUV $1.2-1.4M confirms drive-thru (vs $700K-900K inline weak)
Investment decision: Drive-thru format CRITICAL (TARGET drive-thru locations EXCLUSIVELY, verify aerial photos, 30-40% AUV premium $1.2-1.4M vs inline $700K-900K, stronger rent coverage 6-7% vs 8-10% tight, pandemic-proof resilient COVID-19 90-95% maintained, exit liquidity investors compete, future-proof format Dunkin’ prioritizes, AVOID inline strip mall non-drive-thru inferior economics except dense urban walk-up rare exceptions).
What cap rate should I target for Dunkin’ Donuts NNN properties?
Target 6.0-7.0% cap rates depending on drive-thru format, franchisee strength, geography, and lease term:
Cap rate range guidance:
| Scenario | Target Cap Rate | Investment Profile |
|---|---|---|
| Northeast drive-thru + multi-unit 10+ stores + strong sales | 5.75-6.25% | PREMIUM (best-in-class Dunkin’) |
| Mid-Atlantic/Southeast drive-thru + multi-unit + moderate sales | 6.25-6.75% | STANDARD (typical quality) |
| Florida/growth market drive-thru + developing brand | 6.5-7.0% | GROWTH (higher risk, higher yield) |
| Inline strip mall NO drive-thru (AVOID unless urban) | 6.75-7.25% | INFERIOR (weak format, limited buyers) |
| West Coast California weak brand (AVOID!) | 7.0-7.5%+ | HIGH RISK (brand unfamiliar, poor economics) |
Cap rate determination factors:
1. Drive-thru format (25-50 bps impact!):
- Drive-thru freestanding: 6.0-6.5% (premium pricing, investors compete superior format)
- Drive-thru endcap: 6.25-6.75% (acceptable, drive-thru present but not ideal freestanding)
- Inline NO drive-thru: 6.75-7.25% (discount required inferior economics, limited buyers, AVOID)
2. Franchisee quality (25-50 bps impact!):
- Institutional multi-unit 50+ stores: 5.75-6.25% (financial strength $50M+ portfolio, lowest risk)
- Regional multi-unit 10-50 stores: 6.0-6.5% (professional operators, acceptable)
- Small multi-unit 3-10 stores: 6.25-6.75% (verify financials, moderate risk)
- Single-unit mom-and-pop: 6.75-7.25%+ (high-default risk, AVOID unless exceptional)
3. Geographic strength (25-50 bps impact!):
- Northeast (MA/NY/NJ/PA): 5.75-6.25% (brand loyalty generational, $1.2-1.5M AUV, density advantages)
- Mid-Atlantic/Southeast (MD/VA/FL/GA): 6.25-6.75% (growing brand, $1.0-1.2M AUV, moderate)
- Midwest moderate: 6.5-7.0% (developing, $900K-1.1M AUV)
- West Coast weak: 7.0-7.5%+ (brand unfamiliar, $700K-900K AUV, AVOID)
4. Lease term remaining (10-25 bps impact!):
- 15-20 years full term: 6.0-6.5% (maximum resale value, institutional buyers)
- 10-15 years remaining: 6.25-6.75% (acceptable, verify franchisee renewal commitment)
- <10 years remaining: 6.5-7.0%+ (discount required uncertainty, shorter income stream)
5. Sales performance (25-50 bps impact!):
- Strong AUV $1.3-1.5M: 5.75-6.25% (premium sales support rent, lower risk)
- Moderate AUV $1.0-1.2M: 6.25-6.75% (standard performance, acceptable)
- Weak AUV $700K-900K: 6.75-7.25%+ (tight rent coverage, higher risk, AVOID)
Example cap rate calculations:
Scenario 1: Premium Northeast drive-thru
- Location: Massachusetts, drive-thru freestanding
- Franchisee: Multi-unit 30 stores, $150K EBITDA per store
- AUV: $1.4M (strong sales)
- Lease: 18 years remaining, 10% escalations every 5 years
- Target cap rate: 5.75-6.0% (premium pricing justified best-in-class)
Scenario 2: Standard Florida drive-thru
- Location: Orlando metro, drive-thru endcap
- Franchisee: Regional multi-unit 15 stores, $175K EBITDA per store
- AUV: $1.1M (moderate sales)
- Lease: 14 years remaining, 1.5% annual escalations
- Target cap rate: 6.5-6.75% (growth market, moderate brand, fair pricing)
Scenario 3: Weak inline strip mall (AVOID!)
- Location: Midwest secondary market, inline NO drive-thru
- Franchisee: Small multi-unit 5 stores, $90K EBITDA per store (weak!)
- AUV: $800K (weak sales)
- Lease: 9 years remaining, no escalations
- Target cap rate: 7.0-7.5% (inferior format + weak franchisee + short lease, AVOID even at 7.5% cap!)
Investment decision: Target 6.0-7.0% caps depending on quality factors (Northeast drive-thru multi-unit 5.75-6.25%, Mid-Atlantic/Florida drive-thru 6.25-6.75%, growth markets 6.5-7.0%, AVOID inline <6.75% inferior economics, AVOID West Coast <7.0% brand weak, premium pricing justified superior drive-thru + multi-unit + Northeast brand + strong sales).
Ready to Invest in Dunkin’ Donuts NNN Properties?
American Net Lease specializes in sourcing Dunkin’ Donuts NNN opportunities emphasizing drive-thru format verification (30-40% AUV premium critical, aerial photos + offering memorandum + site visit confirm), multi-unit franchisee targeting (10+ stores preferred, financial statement analysis $150K-250K EBITDA per store, years in system experience 10+), Northeast/East Coast geographic focus (Massachusetts/New York/New Jersey/Pennsylvania/Florida brand strength $1.2-1.5M AUV vs West Coast weak $700K-900K), and competitive pricing analysis (6.0-7.0% cap rate range depending quality factors drive-thru + franchisee + geography + sales).
Benefits of working with American Net Lease:
✅ Buyer representation only — We represent YOU, not sellers/brokers (no conflicts, fiduciary duty)
✅ Drive-thru format verification — Aerial photos, OM analysis, site visits (confirm 30-40% AUV premium!)
✅ Franchisee due diligence — Financial statement analysis, store count verification, years experience (target multi-unit 10+ stores!)
✅ Geographic optimization — Northeast/East Coast focus (Massachusetts/New York/New Jersey/Florida brand strength $1.2-1.5M AUV)
✅ AVOID common mistakes — Inline strip mall weak format, single-unit franchisee risk, West Coast unfamiliar brand (protect from costly errors!)
✅ Transparent cap rate guidance — 6.0-7.0% range depending quality (premium Northeast 5.75-6.25%, growth Florida 6.5-7.0%)
Browse current Dunkin’ Donuts NNN opportunities or schedule consultation:
📞 Call or Text: 239.236.2626
📧 Email: View Dunkin’ Donuts NNN Listings
📄 Download: Morning Daypart Coffee + Breakfast Investment Guide
Related Morning Daypart & QSR NNN Property Opportunities
Coffee Alternatives:
- Starbucks NNN Properties → (Premium coffee, BBB+ corporate guarantee, 5.0-6.0% caps!)
- Tim Hortons NNN Properties → (Canada dominant, US Northeast expansion!)
- Dutch Bros NNN Properties → (West Coast drive-thru coffee, growth!)
Breakfast QSR:
- McDonald’s NNN Properties → (Breakfast 25-30% sales, AA- credit!)
- Panera Bread NNN Properties → (Bakery-cafe, breakfast + lunch!)
- Chick-fil-A NNN Properties → (Breakfast growing, corporate guarantee!)
Fast-Casual:
- Chipotle NNN Properties → (Corporate guarantee, Chipotlane, $3M+ AUV!)
- Wendy’s NNN Properties → (Premium burger, Fresh beef, 6.0-7.0% caps!)
State-Specific Markets:
- Massachusetts NNN Properties → (1,000+ Dunkin’ stores, birthplace!)
- New York NNN Properties → (1,300+ stores, largest state!)
- New Jersey NNN Properties → (800+ stores, commuter density!)
- Florida NNN Properties → (900+ stores, growth market!)
- Pennsylvania NNN Properties → (500+ stores, Philadelphia + Pittsburgh!)
Education & Resources:
- Ultimate Triple Net Lease Guide → (Complete NNN education)
- 1031 Exchange NNN Properties → (Tax-deferred strategies)
- Franchised NNN Properties Guide → (Franchisee due diligence critical!)
- All NNN Properties for Sale → (Full national inventory)
Invest in Dunkin’ Donuts morning daypart NNN properties with drive-thru expertise:
📞 Call 239.236.2626 | 📧 Contact Us | 📄 Download Coffee + Breakfast Investment Guide